
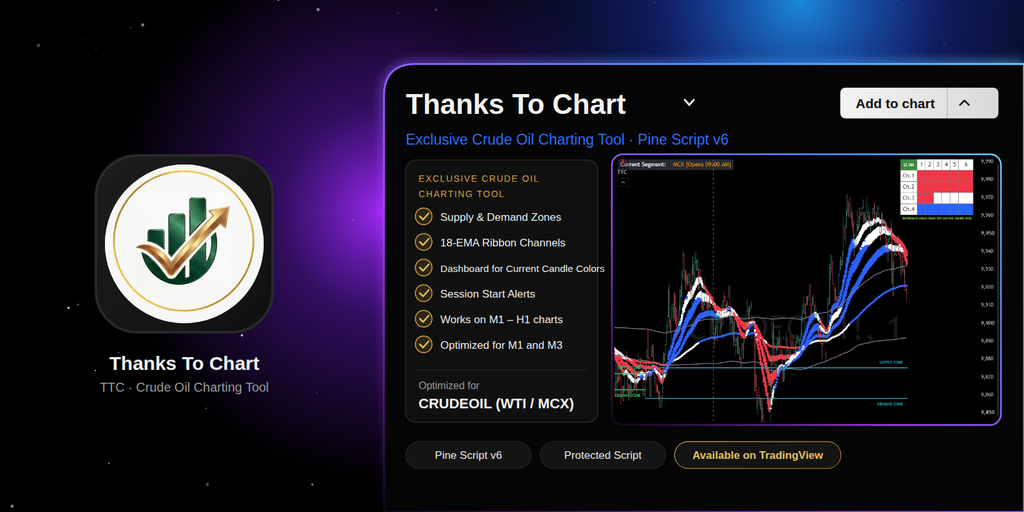
See Crude Oil Charts Differently.
Understand the structure. Learn the indicator. Thanks to Chart keeps your crude oil chart clean and readable, so you can study price with more clarity.
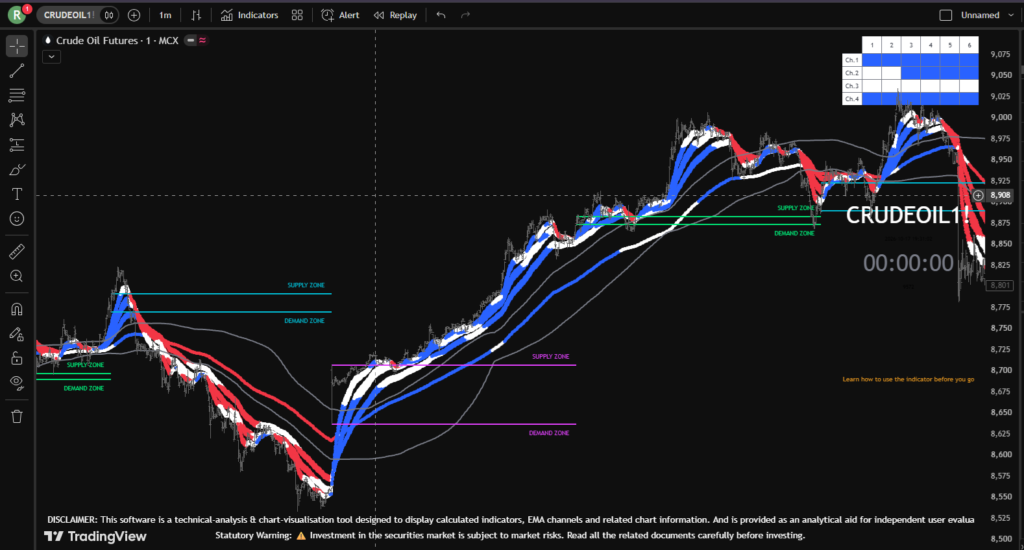
Illustrative chart
Learn Simple. Trade Better.
Learn clean intraday price action & strict risk rules in our FREE live online training. Also get “7 Day FREE TRIAL” of ThanksToChart Technical Charting Overlay”. Tap below to register.
– Only 5 seats per session allowed.
We are not SEBI-registered Investment Advisers or Research Analysts. All training uses historical data (>3 months old) strictly for educational purposes.
Know when each session begins.
Asia, London and US session openings are marked directly on the chart, so you can see how price behaves as each session starts.
Illustrative chart
Bullish Structure.
Discover a new method to identify bullish market structure.
– 1,2 and 3 Channels should be above the Historical Supply & Demand Zones
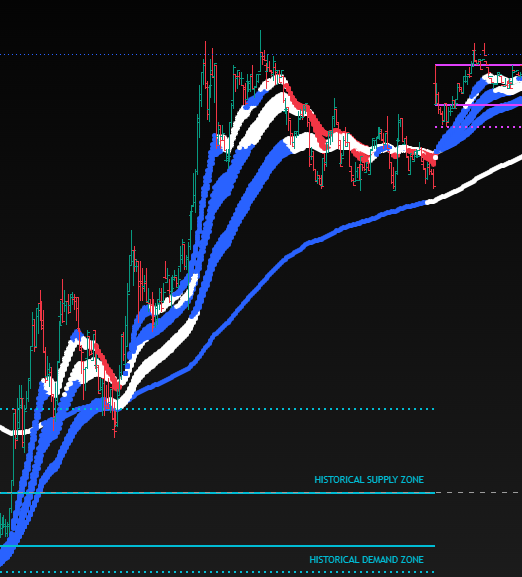
1,2,3 channels are above the Historical Supply and Demand Zones
Bearish Structure.
Discover a new method to identify bearish market structure.
– 1,2 and 3 Channels should be below the Historical Supply & Demand Zones.
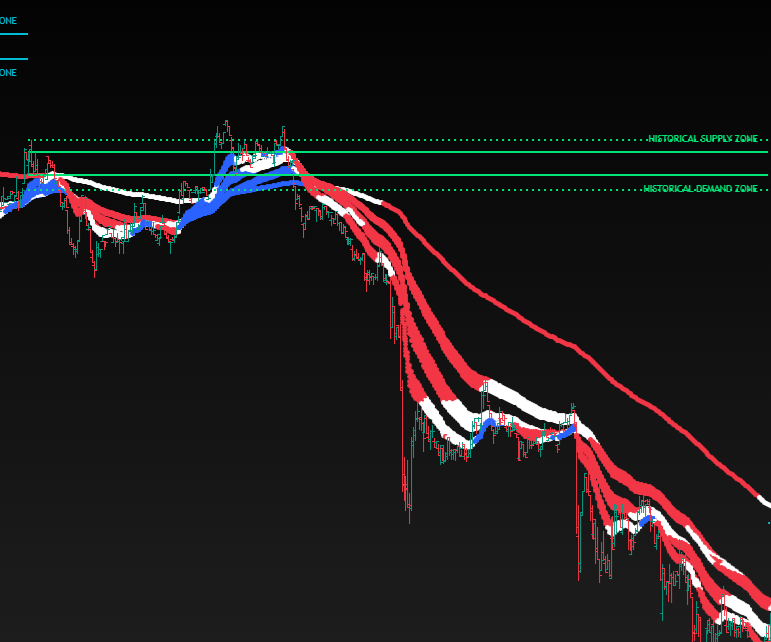
1,2,3 channels are below the Historical Supply and Demand Zones.
Identify 'Areas of Interest'
– Confirm the Bullish / Bearish Structure
– Observe Channel Color alignment.
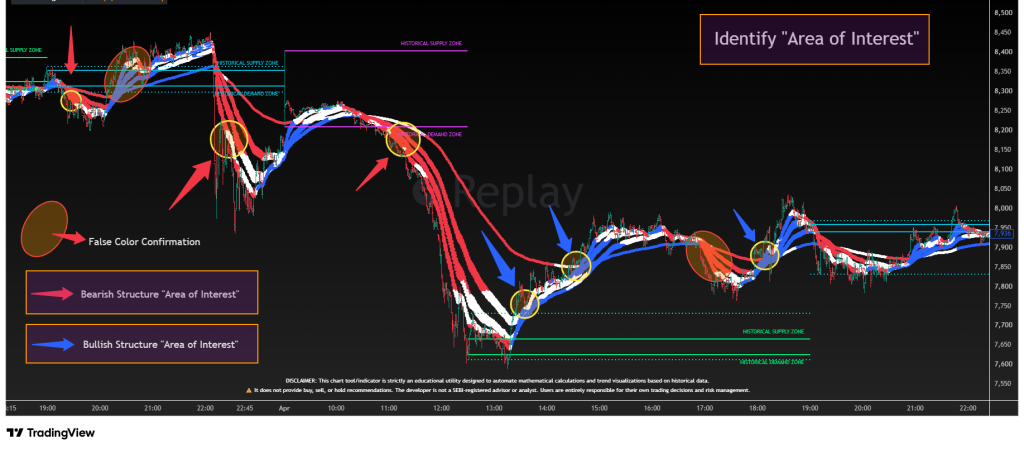
Spot the reaction zones.
Historical supply and demand areas are drawn automatically by the tool’s algorithm, helping you to find Exhausion areas
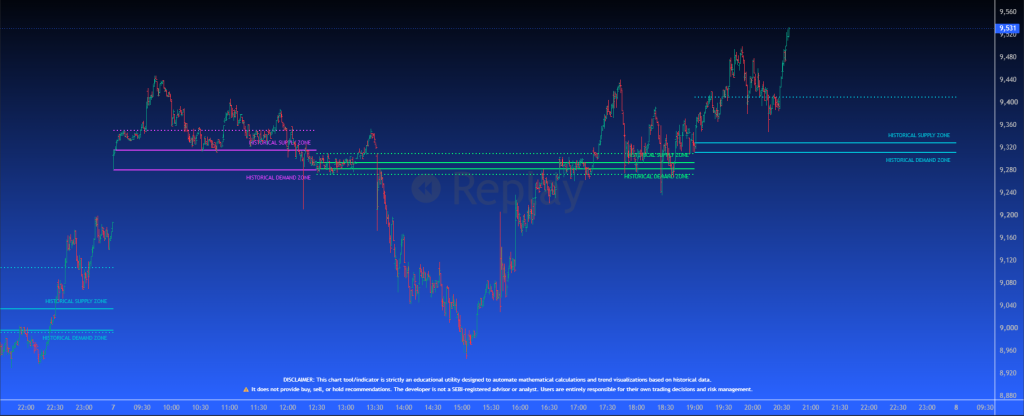
Illustrative chart
Multi-Timeframe Visual Dashboard
– Channel dashboard shows current EMA channel color alignment
– Displays bullish or bearish structure across multiple timeframes
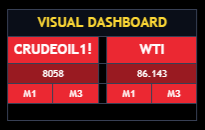
Facility to observe global market behavior at one place.
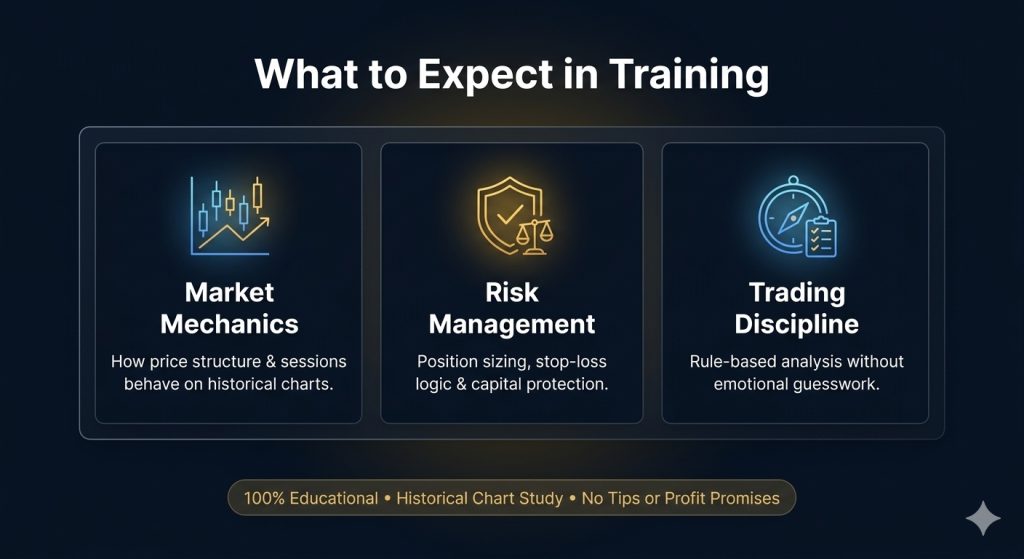
What to Expect in Training
• In this training, we do not focus on profit targets or tips. Instead, we focus on teaching you the mechanics of the market, risk management, and discipline, so that you can make your own independent decisions. Your financial outcome will depend entirely on your capital, strategy execution, and risk control.
Educational tool for chart study. Not investment advice. Trading involves risk. We are not SEBI-registered Investment Advisers or Research Analysts.
See Crude Oil Charts Differently.
Understand the Structure. Learn the Indicator.
Discover ThanksToChart, a technical charting indicator developed in Pine Script exclusively for Crude Oil on TradingView. Originally built for MT4, this tool automates historical data visualization by overlaying dynamic, color-coded trend channels, market structure tracking, and automated supply-and-demand zones directly onto your screen. Explore our educational video lessons to learn exactly how to interpret these visual chart representations and seamlessly integrate them into your own analytical process.
Why ThanksToChart
Built for one market
Designed exclusively for Crude Oil, not adapted from a general-purpose tool.
Learn before you decide
Training videos explain how to read each visual element.
Analysis, not promises
A chart-analysis tool that makes no profit or accuracy claims.
Straight to a conversation
Questions go to WhatsApp, where the team shares approved details.
Explore Crude Oil Chart Analysis
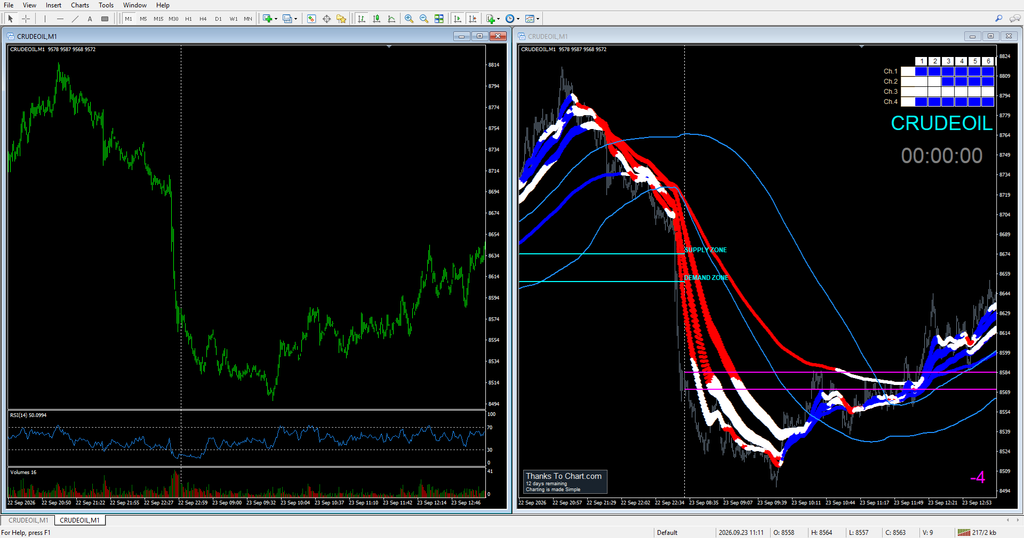
Color-Coded Dynamic Trend Channels
The Visual Elements: The chart utilizes multi-layered, flowing bands that dynamically adjust color configurations based on underlying historical price data variations.
How to Study the Visual Layout:
Blue Ribbon Phase: Shows periods when the calculated values have been rising.
Red Ribbon Phase: Shows periods when the calculated values have been falling.
White Ribbon Phase: Highlights mathematical transition intervals, representing ranges where the immediate directional pace slows down or flattens into a compressed data zone.
When price action experiences a swift downward correction, the tracking bands automatically transition to a solid Red layer to display the rapid drop in historical data values. Conversely, when the downward progression halts and changes direction, the bands shift to White to mark the data transition phase. “The ribbon may change colour as the calculation updates. It describes past data and is not a forecast.”
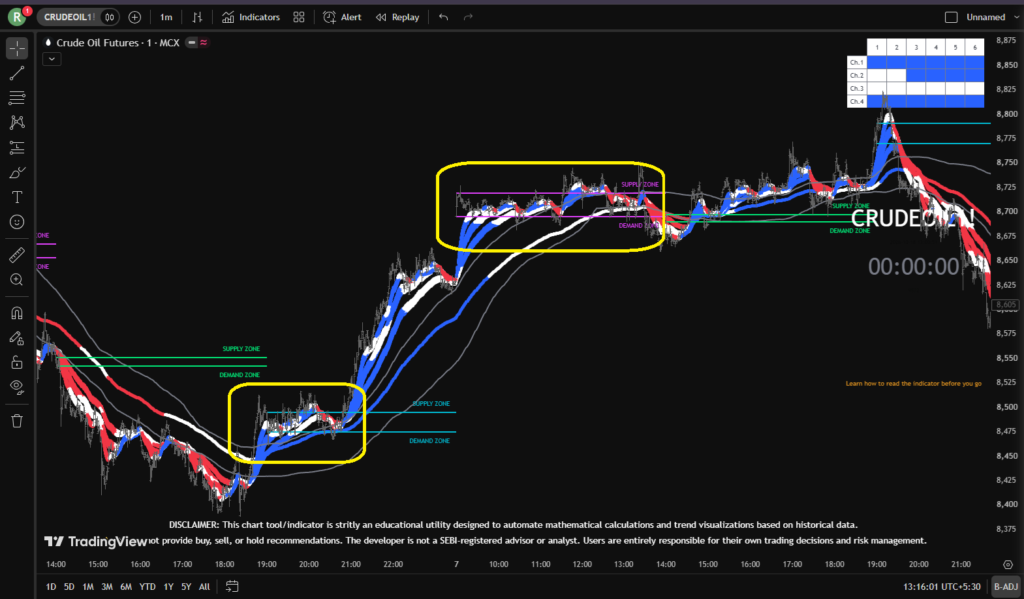
Visualisation of Market Consolidation (Range-Bound States)
The charting tool provides specific visual frameworks to help users observe periods when the market enters a consolidation stage, characterized by a tightening of mathematical parameters.
1. Mathematical Compression Within Structural Zones
The Visual Tracking: As highlighted within the marked boundaries on the chart, the price action moves into a sideways corridor where the dynamic trend bands compress horizontally.
Zone Containment: During these phases, the calculated channels (such as Ch 1 and Ch 2) flatten and remain contained entirely within the pre-plotted historical boundary lines (labeled as the “SUPPLY ZONE” and “DEMAND ZONE”).
2. Analytical Significance of Consolidation Tracking
Muted Directional Bias: When the structural channels compress between these horizontal levels, it indicates a period of market equilibrium where neither upward (bullish) nor downward (bearish) momentum is dominant.
Color Transition Indicators: The multi-layered ribbons frequently transition into a neutral White Phase or alternate rapidly during these ranges. This shows period when the calculated values are flat or compressed.
Purely Informational Evaluation: This visual setup allows users to identify compressed, range-bound historical price environments. This tool tracks these phases mathematically to provide structural context, without indicating future breakout directions, predicting price expansion, or suggesting trade placement.
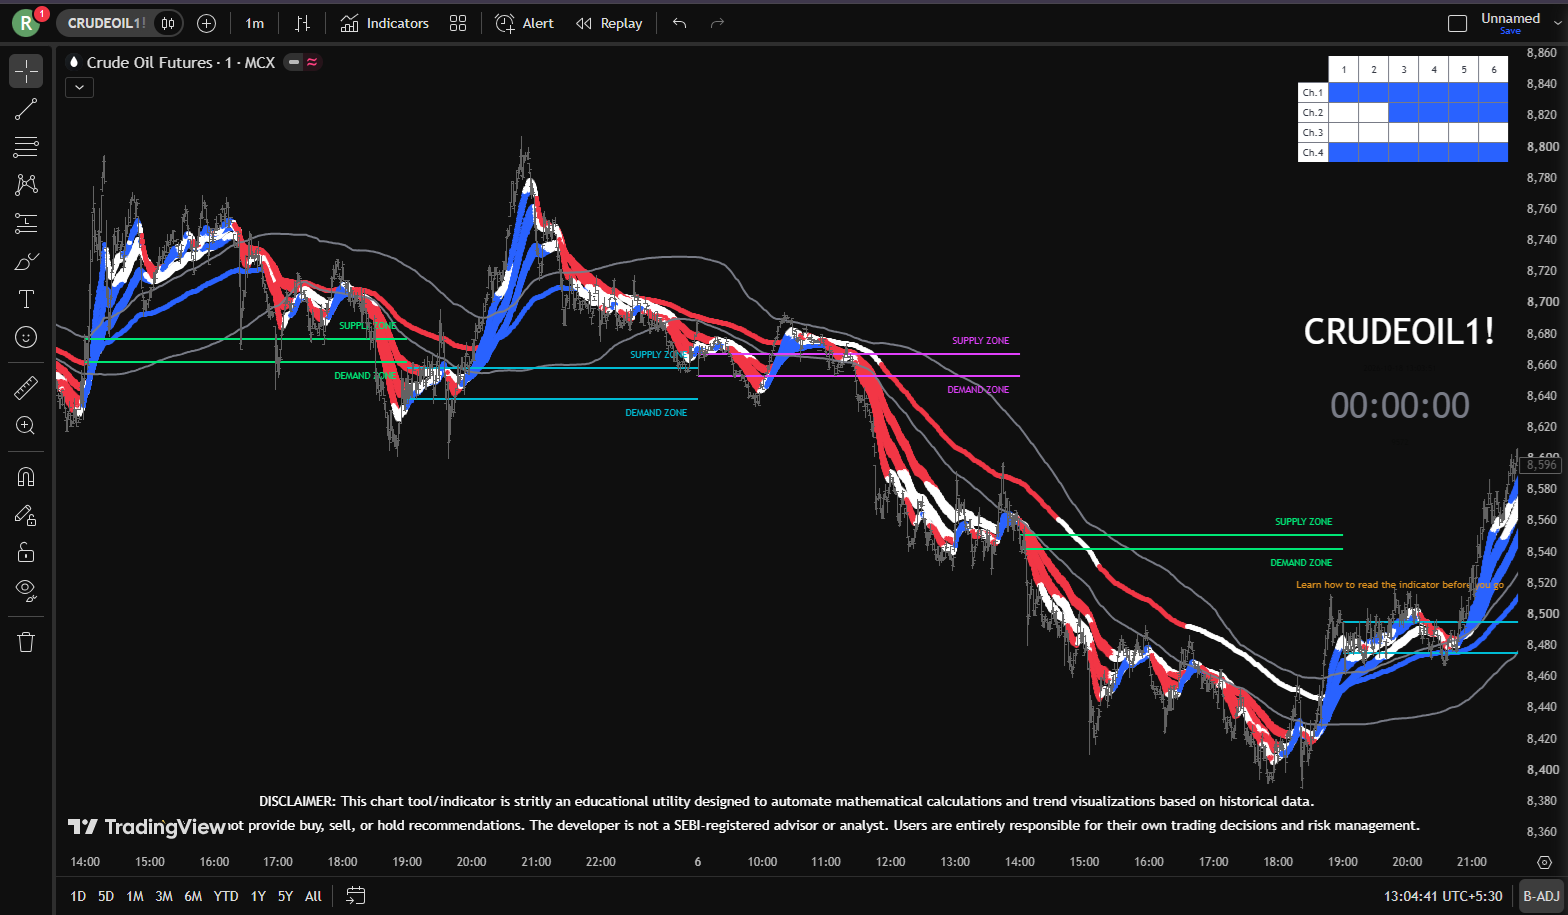
Historical Supply-and-Demand Zones
Visual Reference Lines: Two horizontal cyan lines are automatically plotted across the chart layout based on historical price mathematical calculations, labeled as structural support and resistance references (“Historical SUPPLY ZONE” and “Historical DEMAND ZONE”).
These horizontal lines project historical areas of price concentration where support and resistance have previously occurred. When analyzing the layout, a user can observe how historical price action interacts with these levels alongside the trend channel’s color changes.
These lines show areas where price has reacted before. They are reference lines, not signals.
Pricing
7 Day FREE Trial
₹ 0
No card required. Access shared via Whatsapp after you send your TradingView username.
Get 7 days of invite-only access applied directly to your TradingView username. Explore the educational charting tools free for 7 days.
Monthly
₹ 2345 5999
Plus 18% GST applicable
Get access to the TTC Crude Oil technical charting indicator on TradingView.
Indicator access for 1 month.
💡 Important Access & Licensing Notice
ThanksToChart provide a strictly 7-Day Free Evaluation Trial to allow users to independently review our historical data visualization tools.
Users are encouraged to thoroughly test the indicator during this trial period. If you determine that the visual framework aligns with your personal trading strategy, you may independently opt to purchase a subscription.
Indicator access is provided strictly for educational and analytical purposes. No trading signals, advisory services, or assured returns are provided.
Learn the ThanksToChart Crude Oil Indicator
About Thanks To Chart Indicator
Understand dashboards and how color functions within them
Key observations from this past session:
- Total EMAs Used: The setup utilizes a total of 19 EMAs, each built on distinct mathematical formulas.
- What is a CHANNEL: Out of the core EMAs, groups of 6 EMAs are combined and collectively referred to as a CHANNEL.
- How many CHANNELS are used: There are 3 primary Channels. A remaining single EMA (200) functions independently as a long-term structural reference.
- How many ZONES: 1 Historical SUPPLY zone and 1 Historical DEMAND zone are automatically plotted on the chart for each session.
- How many SESSIONS: The tool tracks 3 major analytical trading windows daily: the Asian/Indian Session, the London Session, and the US Session.
Understanding these static, past market structures helps build strong analytical foundations without relying on guesswork or emotional trading.
How to Identify Choppy & Consolidation Markets Easily 📊
In this educational walkthrough, we break down how historical price momentum flattens during periods of market indecision.
Key observations from this past session:
- EMA Compression: Notice how the Exponential Moving Averages (EMAs) enter a tightly compressed zone between the historical supply and demand lines.
- Momentum Flattening: When these channels align horizontally as a single line, it typically reflects a lack of directional bias—marking a classic consolidation phase.
- Automated Anchors: Looking at historical supply and demand levels can help clarify where previous market participants found value, providing structural context without predicting future outcomes.
Understanding these static, past market structures helps build strong analytical foundations without relying on guesswork or emotional trading.
Why Channel Colours Matter Even After Structural Confirmation | Thanks To Chart Tutorial
- Description:
- In this tutorial, we study why channel colours still matter after a structure has been confirmed. The core idea is simple: structure tells you WHERE, and channel colours tell you HOW. Reading both together helps you judge whether a structure on the chart looks genuine or false, using historical data only.
- We walk through three historical MCX Crude Oil case studies (2, 6 and 7 April 2026) using the Thanks To Chart indicator, which automatically plots historical supply and demand zones for each session.
- What you will learn:
- How the Asian, London and US sessions feed into the zones for the next session.
- How historical supply and demand zones mark where structure forms
- How channels 1, 2 and 3 crossing above or below the zone lines confirms the structure
- How channel colours (blue or red) and compression show whether that structure is genuine or false
- How to spot choppy or consolidation phases when channels sit inside the zones
- Why blue does not automatically mean bullish and red does not automatically mean bearish
Understanding these static, past market structures helps build strong analytical foundations without relying on guesswork or emotional trading.
Important: This video uses historical data for educational purposes only. The tool does not provide buy, sell or hold recommendations or trading signals. The developer is not a SEBI-registered advisor or analyst. Past performance does not indicate future results, and trading involves risk. You are solely responsible for your own decisions.
Frequently asked questions
What is ThanksToChart?
A chart-analysis indicator for Crude Oil, with educational training to help you read it. Learn Simple. Trade Better.
Why was “Trade with Colours” changed to “Thanks to Chart”?
We updated the name from “Trade with Colours” to Thanks to Chart to better reflect our focus on clear, chart-based trading insights. You can still access all the same color-coded indicators and tools under this new name.
Which market is the indicator designed for?
ThanksToChart is designed exclusively for Crude Oil chart analysis.
Which platform supports the current indicator?
The current indicator is developed in Pine Script for TradingView.
Which timeframes does the indicator support ?
The current indicator is mathematically designed and optimized for M1 and M3 timeframes only.
Will the current indicator support for other symbols like Gold, Crypto, Bank Nifty etc.,?
The current indicator exclusively designed for CRUDE OIL only.
Does he indicator support for Future & Options Trading?
YES. ThanksToChart is a charting tool for Crude Oil charts on TradingView. It gives no trade recommendations. Trading in commodity derivatives involves substantial risk of loss
What do the indicator’s visual features represent?
They represent trend, market structure and supply-and-demand zones on Crude Oil charts. See the features section and training videos for detail.
Is training available?
Yes. Educational videos are in the Training section.
Is training available during the FREE TRIAL?
Yes, you can access all educational videos in the Training section during your free trial.
How does the 7 days free-access offer work?
The introductory campaign offers free access for the first 7 days, subject to the approved offer and TradingView access conditions. Our team shares the current details on WhatsApp.
How do I request access?
Start a WhatsApp conversation and send the prefilled message. You will receive the approved access instructions. Opening the link does not grant access by itself.
How can I contact the team?
Use the WhatsApp button using the address in the Contact section.
Does the indicator guarantee profits?
No. ThanksToChart is a chart-analysis tool and does not guarantee trading profits or outcomes.
Is the indicator suitable for beginners?
Yes, the visual interface is beginner-friendly. ThanksToChart uses a clear, color-coded layout that makes it simple to observe how technical data and historical patterns map out on a chart.
Does ThanksToChart provide personalised investment advice?
No. It provides chart-analysis tools and education only. Decisions remain your own.
Does ThanksToChart provide auto trading ?
No. It provides chart-analysis tools and education only. Decisions remain your own.
Does ThanksToChart support Swing trading ?
ThanksToChart is designed for intraday chart analysis on M1 and M3 timeframes.. While swing traders can use the system if it fits their strategy, they do so at their own discretion. ThanksToChart does not officially recommend or support swing trading
How accurate is the ThanksToChart charting tool?
ThanksToChart does not claim a specific accuracy percentage, as financial market analysis tools cannot guarantee future performance. ThanksToChart does not claim any accuracy or success rate. Past data does not indicate future results
Is the ThanksToChart tool available outside TradingView?
No, the indicator code runs exclusively on the TradingView platform. However, your subscription licensing, billing management, and user authentication are hosted and processed securely right here on our official website (Thankstochart.com) via our integrated payment gateways.
Does the ThanksToChart tool work on all devices?
Yes. Since ThanksToChart operates directly inside the TradingView platform, it works flawlessly on any device that supports TradingView. You can access it via your web browser on desktops and laptops, or use the official TradingView app on your smartphone, tablet, or iPad.
Can I share screenshots?
If you use or share any screenshots or visual analysis from the tool on external websites or social media, proper ‘Charts by TradingView’ attribution must remain clearly visible.
Is ThanksToChart SEBI-registered?
No. ThanksToChart is not a SEBI-registered investment adviser or research analyst. It provides educational charting tools only.
How does the Visual Dashboard work?
The Visual Dashboard consolidates key structural readings into a single on-screen panel so you do not have to switch between multiple charts. It displays the real-time Bullish or Bearish structure alignment and EMA channel color states across both M1 and M3 timeframes, while simultaneously tracking the global WTI Crude Oil benchmark. This unified view lets you observe how local intraday structures compare with global Crude Oil behavior in one place for cleaner, more structured chart study. (Note: This dashboard is an analytical visualization tool only and does not provide trading signals or investment advice).
Why is ThanksToChart designed exclusively for Crude Oil?
Every financial market has its own volatility, liquidity, and session rhythm. Rather than building a generic, one-size-fits-all tool, ThanksToChart is mathematically calibrated specifically for Crude Oil’s intraday price behavior on M1 and M3 timeframes.
Additionally, Crude Oil offers an extended trading window from 9:00 AM to 11:30 PM, spanning the Asian/Indian, London, and US sessions. This wide schedule makes the market accessible to all types of participants—whether you are a full-time market observer or a working professional who can only study charts in the evening. Focusing on a single market allows our 19-EMA channel structure and automated Supply & Demand zones to remain clean, consistent, and tailored to this exact session flow.
Is disciplined trading is possible with this tool?
ThanksToChart provides a clean, objective visual framework — using automated zones and color-coded channels — to help you stay consistent and disciplined in how you study charts. However, trading discipline and risk control remain entirely your own responsibility.
How much capital is required to trade MCX Crude Oil ?
Capital requirements depend on the contract type and current exchange volatility margins (SPAN + Exposure):
- Crude Oil Futures (Standard – 100 Barrels): Typically requires ₹2.50 lakh to ₹3.00 lakh in exchange margin. Traders generally maintain an additional cash buffer (around ₹3.50 lakh total) to handle daily Mark-to-Market (MTM) fluctuations.
- Crude Oil Mini Futures (10 Barrels): Requires roughly one-tenth of the standard margin, around ₹25,000 to ₹30,000 per lot.
- Crude Oil Options (Buying): Requires only the option premium, which generally ranges from ₹10,000 to ₹50,000 for standard contracts (or ₹1,000 to ₹5,000 for Mini options), depending on the strike price and time to expiry.
- Crude Oil Options (Selling): Requires nearly the full futures margin (around ₹2.50 lakh+ per standard lot).
Note: Margin requirements change frequently based on crude oil prices and exchange rules. Always check your broker’s live margin calculator before trading. This information is for educational purposes only and is not financial or investment advice.
Have Questions? Let’s Connect.
Want to understand the ThanksToChart Crude Oil indicator, explore the training resources or learn about the current access offer? Start a conversation with our team.
Prefer email? support@thankstochart.com
After opening WhatsApp, send the prefilled message so the automation can start.
🏛️ Registered Entity / Institution : THANKS TO CHART
- UDYAM Registration Certificate # : UDYAM-TS-02-0380376
- GSTIN : 36AOIPK0368M1ZL
📞 Contact Information & Support
- Registered Office: 1-4-200/96B, Eswaripuri Colony, Kapra Lake Road, Sainikpuri, Hyderabad – 500094, Telangana, India.
- Operational Chat & Inquiry Support: Connect with our automation team via our official WhatsApp Business Link or via SMS at +91 7396523339 to request onboarding instructions.
- General Customer Support: support@thankstochart.com (For general access queries and onboarding assistance).
- Legal, Grievance & Access Escalations: For technical disputes, indicator performance inquiries, or compliance questions, please email complaints@thankstochart.com.
Billing and Access :
- Billing Administration: All software licenses and subscription plans for the ThanksToChart indicator framework are processed securely right here on our official website. Once your payment is verified, access is manually provisioned directly to your TradingView username within 2–4 hours.
- Disclaimer: ThanksToChart operates strictly as an educational technical framework built to automate historical data visualization. The developer does not provide custom advisory services, signal generation, or performance guarantees.
- Trading in commodity derivatives involves substantial risk of loss. Past data does not indicate future results.
- ThanksToChart is not affiliated with or endorsed by TradingView. Charts by TradingView.